
Chocolate Bar Visualization using D3.js
Introduction
It’s a INFO 5100 - Data-Driven Web Applications class project at Cornell University, we need to creating a non-interactive data visualization.
After exploring different datasets and ideas, our team decided to visualize the data of American chocolate bar.
We created two visualization to tell the story of chocolate bar, the first map tells you the origin of cocoa beans used to make American chocolate bars, the scond chocolate bar plot tells you the detailed quality of cocoa beans for each country.
You can find the code in my github.
Story of the first map
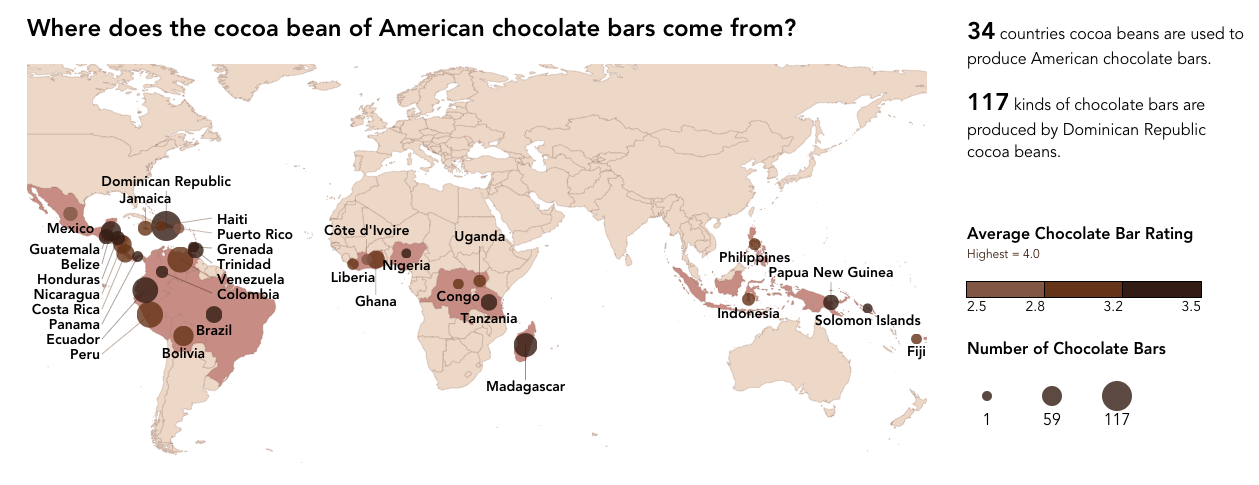
Do you know where does the cocoa beans used to make American chocolate bars come from? From the map, we can first identify that all of the cocoa beans are from the tropics, and among those cocoa beans, most of them come from Central and Southern America. The size of each circle indicates the number of American chocolate bars produced by the country’s cocoa beans. Dominican Republic has the largest size with 117 American chocolate bars. The shade for the country represents the average rating of American chocolate bars. There is an even spread of cocoa bean origin for the quality of American chocolate bars produced.
Story of the second chocolate bar plot
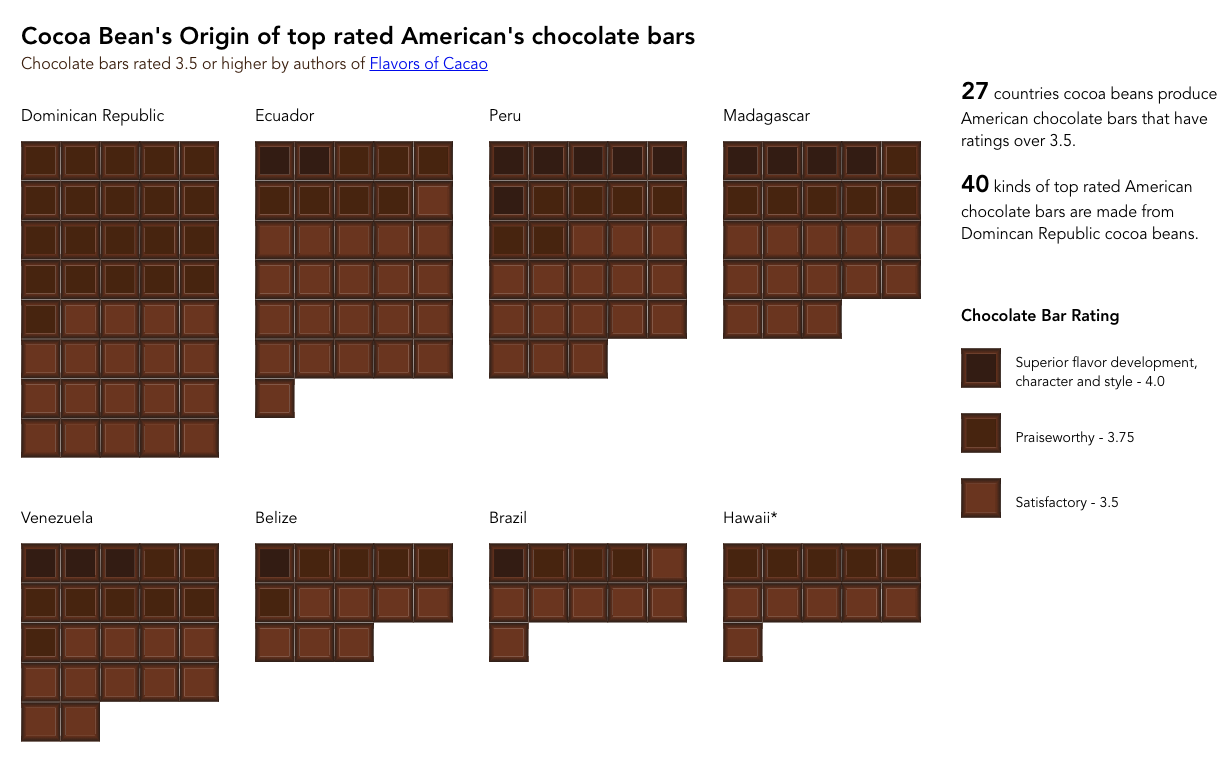
We then further explore the origins of cocoa beans for top rated American chocolate bars. The second visualization shows all the countries that have cocoa beans used to produce at least one American chocolate bar with rating 3.5 or more. Each country’s big chocolate bar is made up of squares representing top rated American chocolate bars that is produced by the country’s cocoa beans. Dominican Republic cocoa beans produced the most type of top-rated American chocolate bars at 27. Only cocoa beans from Peru produce a substantial amount of American chocolate bars with 4.0 rating as represented by the shade of the smaller square in each country chocolate bar. Although Dominican Republic cocoa beans are used to produce a large amount of American chocolate bars, none of it was given the highest rating at 4.0.
Data
This dataset contains a collection of expert ratings of over 1,700 chocolate bars with information on their percentage of cocoa, chocolate beans used and the origin of these beans. These ratings were compiled by Brady Brelinski, Founding Member of the Manhattan Chocolate Society.
Source: Kaggle: chocolate-bar-ratings
We only use the data where the Company Location is “U.S.A” as we want to study the American chocolate bars.
Additional Data
- World Map - world-50.json from d3-geo.
- Country code ISO 3166 - countryCodes.json is from ISO-3166-Countries-with-Regional-Codes
- Country latitude and longitude - countryposition.json is from Country List ISO 3166 Codes Latitude Longitude
- Chocolate bar SVG - Created by Stella using Illustrator
Data Modification
We preprocess our dataset to ensure that data is consistent and ready to use.
- Convert Cocoa Percent and Rating to numeric values
- Split row with more than one country in Broad Bean Origin
- Convert shorten country name to full name for Broad Bean Origin, e.g. “Mad.” to “Madagascar”, “Ven.” to “Venezuela”, “PNG” to “Papua New Guinea”
- Change “Domincan Republic” to “Dominican Republic” for Broad Bean Origin
- Change “Viet Nam” to “Vietnam” for Broad Bean Origin
- Change “Bali” to “Indonesia” for Broad Bean Origin
Mapping
Cocoa bean origin of American chocolate bars
| Elements on the map | Corresponding Data |
|---|---|
| Location of circles | Longitude and latitude of broad bean origin country |
| Shade of the country land | Countries which produce cocoa beans for American chocolate bars |
| Shade of the circles | Average rating of chocolate bars on a scale of 2.5 to 3.5 |
| Size of the circles | Number of chocolate bars from 1 to 117 |
For the location of circles, we first used project method in d3.geo to project path from world-50.json to show the world map, then we projected the longitude and latitude of countries to the x and y on the svg.
For the shade of country land, we mapped country code with the countries in the chocolate dataset. For countries that has cocoa beans used to produce American chocolate bars, we filled the land with color “#999”, otherwise, we filled with “white” color.
For the shade of circles, we used d3.scaleQuantile() to map the input of average ratings on a scale of 2.5 to 3.5 to a discrete range of 3 color categories, which are “rgb(140, 97, 77)”, “rgb(112, 59, 24)” and “rgb(58, 30, 17)”.
For the size of the circles, we used d3.scaleSqrt() to map the input of number of chocolate bars from 1 to 117 to the radius of the circle from 5 to 15.
Breakdown of countries producing top rated chocolate bars
| Elements on the map | Corresponding Data |
|---|---|
| Order of Broad Bean Origin (left to right) | Descending order based on the number of chocolate bar with rating more than or equal to 3.5 |
| Order of square in chocolate bar (left to right) | CDescending order based on Bar’s Rating |
| Shade of square in chocolate bar | Bar’s Rating on a scale of 1 to 5 |
We only show the countries that have cocoa beans used to produce at least one American chocolate bar with rating 3.5 or more.
For the shade of the square in each origin’s chocolate bar, we map the chocolate bar rating from [3.5, 3.75, 4.0] to discrete hex color, [“#753d22”, “#51280d”, “#3a1e11”].